Statistics
We’re introducing three advanced charts for invoices, mileage, and timesheets that make it easier to monitor your company’s performance. The most important insights are always at your fingertips — right on the first screen of your eFaktura.nl account.
Next, you can expect new statistics for expenses.
Invoice statistics
In this section, you’ll find six reports that help you better understand how your revenue is performing:
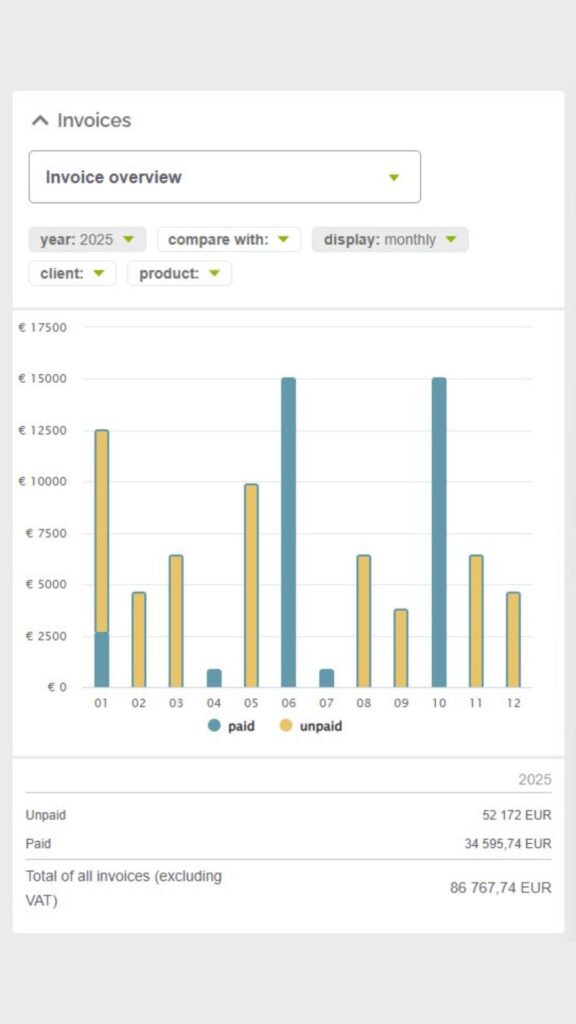
- Invoice summary – select a year, quarter, or month and see your total net turnover over time.
- VAT from invoices – track the VAT amount from your issued invoices. This is especially useful when preparing for quarterly returns.
- Top clients – net amount – find out which clients bring you the most revenue.
- Top clients – number of invoices – see who is the most active in terms of orders.
- Top products – net amount – check which services or products generate the highest income.
- Top products – quantity – analyze which items you sell most often.
Tip: You can compare data between years and quarters, which makes it easier to analyze seasonality and growth.
Mileage statistics
You get a clear overview of your registered kilometers — automatically split into business and private trips, and covering all vehicles and transport types.
- Choose a period (month, quarter, year) and the system will automatically calculate the total kilometers traveled.
- Analyze data for different vehicles and transport methods you’ve added to the system — e.g., cars, vans, motorcycles, or bikes.
- For business trips with a private car, the system also shows the total amount you can claim, calculated according to the Dutch mileage allowance.
- Private trips are displayed separately — for full transparency.
Tip: Regular mileage analysis helps you spot too many private kilometers (important when avoiding bijtelling) or underreported business trips, both of which can affect your tax return and actual cost refunds.
Timesheet statistics
You can analyze how many hours you worked in a chosen period — with a clear breakdown by client and project.
- Select a time range (month, quarter, year) and see the total recorded hours.
- Filter by client or project to see how your work is distributed.
- Charts help you identify which assignments take the most time and which are the most profitable.
- If you run multiple projects for one client, you get full transparency — you can see where most of your time and energy goes.
Tip: Use the data to optimize and consciously manage your working time. See which projects are time-consuming, which are most profitable, and where time “leaks” away.
The Statistics feature is available in the Standard and Pro plans.